434
Views & Citations10
Likes & Shares
Aim: The study aimed to assess the determinants of duration of labor and mode of delivery among women giving birth at SDH, using hospital deliveries.
Results: Abnormal labor (AOR 3.562), and aged ≥35 years (AOR 2.558) increased the odds of prolonged first stage of labor, and cephalic presentation (AOR=0.119) (>12 h) reduced the duration. Abnormal labor (AOR=51.418) was associated with CS delivery. Urban residence (AOR=0.596), and gravida 2 to 4 (AOR =0.402) reduced the odds of CS delivery.
Conclusion: Determinants for duration of labor and mode of delivery were identified. Strategies need to be available to quicken the detection of abnormal labor and signs of prolonged labor for timely interventions.
Keywords: Mode of delivery, Duration of Labor, Hospital Deliveries, Serengeti District Hospital
In Tanzania, national reports showed that out of 1,000 live births taking place in the country, 5 women died daily due to pregnancy-related complications [5]. Based on the Tanzania Demographic Health Survey (TDHS) of 2015/2016, the MMR stood at 556 per 100,000 live deaths, which made Tanzania to be among the countries with the highest MMR in sub-Saharan Africa [6]. Maternal mortality and morbidity post-delivery can be due several maternal birth complications; which comprise poor uterine contractions during labor, perineal tears, cesarean and instrumental deliveries, and obstetric hemorrhage post-delivery [7-9].
BACKGROUND
Normal maternal birth outcomes depend much on the nature of labor. A normal labor is considered if it is associated with effective uterine contractions of sufficient intensity, frequency, and duration to bring about demonstrable effacement and dilation of the cervix [10], and ending within the expected duration [11]. The first stage is considered abnormal if it lasts longer than 12 h [11]. Similarly, second stage of labor is considered prolonged if it exceeds 3 h if regional anesthesia is administered or 2 h in the absence of regional anesthesia for primpara woman. For multipara, if it exceeds 2 h with regional anesthesia or 1 h without it [10]. Faults in power, passage, and passenger can adversely affect both first and second stages of labor [11], attributing to maternal and fetal morbidity and mortality [12]. It is estimated that 303,000 maternal mortalities had occurred globally from pregnancy, labor and delivery complications [13]. The most cited obstetric factors as related to prolonged duration of labor is obstructed labor [14,15]. Maternal age is associated with prolonged second stage of labor [14-17].
Regarding mode of delivery, cesarean section (CS) delivery is the commonest obstetric operative worldwide [18-21]. It is mainly performed as a lifesaving intervention especially for obstetric emergencies such as obstructed labor, previous scar, impending uterine rupture [20-24], and pre/eclampsia and HIV/AIDS [8,9], deliberately performed to achieve the UN 2030 agenda of reducing maternal and neonatal mortalities [25]. Sociodemographic characteristics such as maternal age, marital status and residence [26-29], and antenatal care status [8,30] are also documented as non-obstetric factors which contribute to choosing either CS or SVD as the mode of delivery for the current pregnancy.
Based on the resent findings, the global CS deliveries rate is 21.1%, the average of 5% in sub-Saharan Africa (SSA) and the average of 42.8% in Latin America and the Caribbean [31]. However, based on a literature review study that included 12 countries in SSA, the rate of CS deliveries ranged from 14%-24% (average: 19%) [32]. On the other hand, according to one study conducted among two countries - Tanzania and Kenya; the CS deliveries rates ranged from 5% among uneducated, rural Tanzanian women to 26% among educated urban women in Kenya to 37.5% among managers in urban Tanzania [33]. The ideal rate of CS deliveries based on the WHO recommendation should be between 10% and 15% [34], though national CS rates of up to 19 per 100 live births is associated with lower maternal or neonatal mortality among WHO member states [35]. However, studies have noted some CS deliveries are performed without genuine indications [23].
The need to analyze the determinants of duration of labor and mode of delivery among women giving birth at SDH is significant because they are not well known in the study area. In Mara region, 55% girls and adolescents are married at the age of 18 or below [36]. Regarding male dominance culture of the region, especially Serengeti district, married women do not participate in decision making regarding their reproductive health care, indicating the risk for prolonged duration of labor, owing to delayed household decision [37]. Reports documented that only 8% of married women in Mara region can participate in household decisions [36]. Understanding the determinants may inform the responsible parties the appropriate interventions on a timely basis.
METHODS
Study Design and population
This study a cross-sectional design that was adopted to analyze clinical data using hospital delivers from January to December 2021. The study included all women who attended at the facility within the respective period of study. Only women aged 15-49 years, whose partograph were completely filled were systematically selected.
Study Area
The study was conducted at Serengeti District which is one of the nine district councils of Mara Region of Tanzania. The capital town for Serengeti district is called Mugumu. It is home to part of the world-famous Serengeti National Park; a UNESCO World Heritage Site. The study involved Serengeti district hospital which is a public hospital. This hospital is the only public hospital considered as a referral hospital within the district.
Sample and Sampling Procedure
The sample size was calculated using the formula acceptable for known population: n = N/1+Ne2 (38). According to this formula, n is the sample size, N is the size of the population and e is the level of precision (marginal error), whereby N = 780, and e = 0.05 (5%). The calculation was carried out as, 780/1+780 * 0.052 = 400. Hence, n = 400 participants. A systematic sampling technique was employed for selecting eligible participants for this study. Using delivery register (MTUHA book 12) and partograph the sampling frame was developed. The delivery register was used to confirm the number of deliveries per month where by average eighty women gave birth at the hospital, giving a total of (80 x 12) 960 postnatal women for a year. After understood the average deliveries per month, the partographs were reviewed for completeness, and those with incomplete information were removed from the list and remained with 780 partographs. The partograph stood as proxy to real participant. To obtain the participant with eligible criteria, the interval, k, was calculated as follows: N/n, 780/384 = 2. Therefore, from the sampling frame, the first patient was picked randomly, then, subsequently every 2nd patient (using partographs) was picked until the required sample size was reached.
Data Collection Method
This study employed secondary data available at the health facility regarding hospital deliveries. The partograph was used as a source of data and data collection tool. As a tool of data collection, the following information were extracted from the partograph(s): (i) sociodemographic characteristics, (ii) antenatal characteristics, (iii) intrapartum variables, and (iv) maternal and neonatal birth outcomes. The nurse manager for maternity ward and the hospital medical superintendent was consulted for permission to use the hospital data necessary for this study. Any partograph with incomplete information were not used for the study.
Definition of Variables
Sociodemographic characteristics included maternal age, which was categorized into three groups:
Regarding intrapartum variables, the main variables were fetal presentation (categorized as non-cephalic for breech or others and cephalic, if vertex was presented), and fetal position of the presenting part (categorized as right occipital anterior (ROA), left occipital anterior (LOA) or other); “other” as applied for fetal presentation or position of the presenting part in this study refers to presentation or position other than cephalic or breech, and ROA or LOA, respectively. Fetal heart rate (FHR) on admission was measured as normal (120-160bpm), or abnormal (160 bpm), sex of the baby (male or female), and birth weight of the baby (LBW ≤2.4, normal BWT ≥2.5) as defined by the world health organization [43]. Maternal blood pressure on admission was recorded and categorized with reference to the recent guideline for the management of arterial hypertension [44]. Nature of labor was defined as (1) normal or (0) abnormal. Abnormal labor was operationalized to encompass obstructed labor, previous scar, Antepartum hemorrhage (APH), pre/eclampsia, placenta previa or poor progress of labor. The responses for each were at the end quantified into abnormal labor to get the overall score and percentage. This study had two outcome variables: (i) mode of delivery (spontaneous-SVD or cesarean section), and (ii) duration of labor (≤12 h or >12 h). The duration of labor for the current study focused on first stage of labor [11].
Statistical Analysis
Data were analyzed using SPSS version 20. Descriptive statistics were used for categorical data. Both Chi-square test and binary logistic regression models were used to assess the association between sociodemographic and intrapartum characteristics with maternal birth outcomes (duration of labor and mode of delivery). Variables that showed significance in the bivariate logistic regression were taken to multivariate logistic regression. Statistical significance was declared at p-value of < 0.05 with 95% confidence interval (CI) and strength of association was reported by odds ratio (OR).
RESULTS
Sociodemographic and Antenatal Characteristics of Participants
The study involved 400 participants, with mean age (SD) 25.9 ±7.1. Those aged between 20 to 34 years had high frequency (n = 258, 64.5%). Majority were married (n = 378, 94.5%), rural residents (n = 245, 61.3%), and self-referral admission (n = 340, 85%). Regarding antenatal characteristics, participants with high frequency were gravida 2 to 4 (n = 199, 49.8%, para 0 to 1 (n = 179, 44.8%), received ≥3 IPTp-SP (n = 241, 60.3%), and PMTCT2 participants (n = 392, 98%), and (n = 251, 62.8%) were not checked hemoglobin (Hgb levels during antenatal care (Table 1).
Intrapartum Characteristics of the Study Participants
Majority of the woman attended for labor and delivery had optimal SBP (n = 220, 55%), optimal DBP (n = 272, 68%), with mean (SD) of 115.46 ± 8.772 and 72.58 ± 8.313 for SBP and DBP, respectively. Most of them arrived maternity ward with intact membranes (n = 241, 60.3%). FHR ranged between 110 to 160 bpm (n = 386, 96.5%) with mean (SD) FHR of 132.13 ± 8.421. Concerning fetal presentation and position of the presenting part, majority were in cephalic (n = 380, 95%), and LOA position (n = 218, 54.5%), correspondingly. Majority of the newborns were male (n = 217, 54.3%), and birth weight (n = 370, 92.5%) of ≥2.5 kg. The mean (SD) birth weight of the babies was 3.139±0.4829 (Table 2).
Descriptive Statistics of Duration of Labor and Mode of Delivery
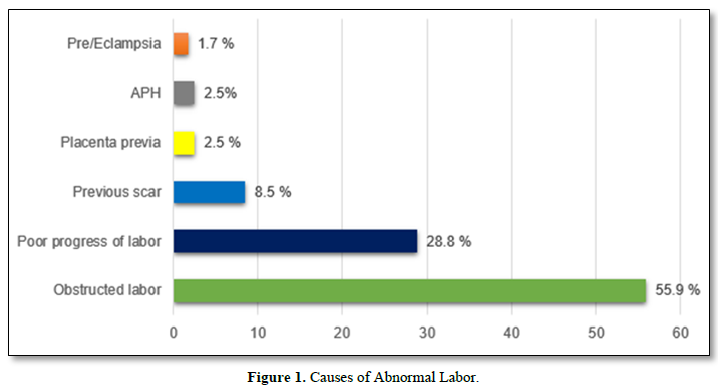
The study noted that (n =102) 25.5% had prolong duration of labor (>12 hours). The mean (SD) duration of labor was 11.36±2.125. About (n = 117, 29.2%) women had CS delivery due to abnormal labor specifically, obstructed labor (55.9%), poor progress of labor (28.8%), previous scar (8.5%), placenta previa (2.5%), APH (2.5%) and pre/eclampsia (1.7%) (Figure 1).
Table 1. Sociodemographic characteristics of participants (N = 400).
|
Characteristics |
Frequency (n) |
Percent (%) |
Mean (SD) |
|
Age (years) |
|
|
|
|
≤19 |
78 |
19.5 |
25.9±7.1 |
|
20 to 34 |
258 |
64.5 |
|
|
≥35 |
64 |
16.0 |
|
|
Marital status |
|
|
|
|
Not married |
22 |
5.5 |
|
|
Married |
378 |
94.5 |
|
|
Residence |
|
|
|
|
Rural |
245 |
61.3 |
|
|
Urban |
155 |
38.7 |
|
|
Type of admission |
|
|
|
|
Medical referral |
60 |
15.0 |
|
|
Self-referral |
340 |
85.0 |
|
|
Gravidity |
|
|
|
|
1 |
83 |
20.8 |
3.71±2.65 |
|
2 to 4 |
199 |
49.8 |
|
|
≥5 |
118 |
29.4 |
|
|
Parity |
|
|
|
|
0 to 1 |
179 |
44.8 |
2.62±2.57 |
|
2 to 4 |
131 |
32.8 |
|
|
≥5 |
90 |
22.4 |
|
|
ANC visits |
|
|
|
|
≤3 |
170 |
42.5 |
|
|
≥4 |
230 |
57.5 |
3.87±1.386 |
|
IPTp-SP prophylaxis |
|
|
|
|
1 to 2 |
159 |
39.8 |
3.02±1.357 |
|
≥3 |
241 |
60.3 |
|
|
HIV status |
|
|
|
|
PMTCT 2 |
392 |
98.0 |
|
|
PMTCT 1 |
8 |
2.0 |
|
|
Hemoglobin level |
|
|
|
|
Not checked |
251 |
62.8 |
|
|
Checked |
149 |
37.3 |
|
Table 2. Intrapartum maternal and neonatal characteristics (N=400).
|
Variable |
Frequency (n) |
Percent (%) |
Mean (SD) |
|
Systolic BP (mmHg) |
|
|
|
|
≤120 |
220 |
55.0 |
115.46±8.772 |
|
120 to 129 |
140 |
35.0 |
|
|
130 to 139 |
38 |
9.5 |
|
|
≥140 |
2 |
0.5 |
|
|
Diastolic BP (mmHg) |
|
|
|
|
≤80 |
272 |
68.0 |
72.58±8.313 |
|
80 to 84 |
114 |
28.5 |
|
|
85 to 89 |
6 |
1.5 |
|
|
≥90 |
8 |
2.0 |
|
|
Membrane status on admission |
|
|
|
|
Intact |
241 |
60.3 |
|
|
Ruptured |
159 |
39.8 |
|
|
Obstetric risk factors |
|
|
|
|
None |
282 |
70.5 |
|
|
Obstructed labor |
66 |
16.5 |
|
|
Other factors |
52 |
13.0 |
|
|
Fetal presentation |
|
|
|
|
Others |
20 |
5.0 |
|
|
Cephali |
380 |
95.0 |
|
|
Fetal position |
|
|
|
|
ROA |
163 |
40.8 |
|
|
LOA |
218 |
54.5 |
|
|
Other |
19 |
4.8 |
|
|
FHR on admission (bpm) |
|
|
|
|
160 |
14 |
3.5 |
132.13±8.421 |
|
110 to 160 |
386 |
96.5 |
|
|
Sex |
|
|
|
|
Female |
183 |
45.7 |
|
|
Male |
217 |
54.3 |
|
|
Birth weight |
|
|
|
|
≤2.4 |
30 |
7.5 |
|
|
≥2.5 |
370 |
92.5 |
3.139±0.4829 |

Relationship of Sociodemographic Characteristics with Maternal Birth Outcomes
Maternal age (c2=17.937, p<0.001), gravidity (c2=22.68, p<0.001), and parity (c2=14.53, p<0.001) showed significant relationship with duration of birth since onset of labor. Intrapartum variables which showed significant relationship with the duration of labor were obstetric risk factors (c2= 36.181, p <0.001), fetal presentation (c2 = 6.652, p=0.010), and fetal position (c2 = 9.351, p =0.009). Mode of delivery showed significant relationship with residence (c2=6.543, p<0.0010, type of admission (c2=87.85, p<0.001), and gravidity (c2=7.024, p=0.034). Other significant variables were obstetric risk factors (c2=309.994, p<0.001), fetal position (c2=10.789, p=0.05), FHR (c2=12.472, p<0.001), birth weight of the baby (c2=3.970, p=0.046), sex of the baby (c2=4.367, p=0.037) (Table 3).
Determinants of Duration of Labor and Mode of Delivery at Serengeti District Hospital
Unadjusted model revealed that participants aged between 20 to 24 years (COR 0.468, P=0.037), those women with gravida 2 to 4 (COR =0.302, P<0.001) and para 2 to 4 (COR = 0.472, P=0.014), and those women with baby’s in cephalic fetal presentation (COR =0.315, P<0.013) less likely to have a duration of labor >12 h. furthermore, women with abnormal labor (COR = 3.975, P <0.001), were almost four-fold more likely to have a duration of labor >12 h. Regarding mode of delivery, factors like urban residence (COR=0.537, P=0.010), self-referral (COR=0.065, P<0.001), gravida 2 to 4 (COR = 0.517, P=0.032), ROA fetal position (COR=0.491, P=0.003), a male baby (COR = 0.646, P=0.050), and FHR between 110 to 160 bpm reduced the odds of CS delivery. Besides, abnormal labor (COR =64.158, P<0.001) increased the odds of CS delivery by more than sixty times. In an adjusted model, age ≥35 years (AOR = 2.558, P=0.046), and women with abnormal labor (AOR=3.562, P<0.001) remained the only significant factor that increased the odds of having a duration of labor >12 h by more than four-folds. However, cephalic fetal presentation (AOR=0.119, P=0.009) indicated that the women were less likely to have a duration of labor >12 h. With reference to mode of delivery, the adjusted model showed that urban residence (AOR=0.596, P=0.031), and gravida 2 to 4 (AOR =0.402, P=0.003) did not indicate the odds of CS delivery, while abnormal labor (AOR = 51.418, P<0.001) increased the odds of CS delivery by more than fifty times (Table 4).
DISCUSSION
The main purpose of this study was to examine the determinants of duration of labor and mode of delivery among women giving birth at Serengeti district hospital using clinical data of hospital deliveries. Overall findings indicated that more than half (62.8%) arrived at labor ward without ever checked Hgb during ANC, 39% with membrane already ruptured, 25.5% had prolonged duration, and 29.2% underwent CS delivery, of which more than half was due to obstructed labor.
Regarding predictors of duration of labor, older women (aged ≥35 years) had an increased likelihood to have a prolonged labor (>12 h) by more than two-folds, similar to what was reported by another study [16]. Concerning another study, regardless of its dissimilarity and incomparable study focus and model of data analysis with the current study, it can still provide a concrete evidence to support our results. The findings accentuated that as maternal age increased, so likelihood of second stage of labor increased as well [12]. A study conducted in China on the same phenomenon concurred the results of this study [17]. Based on obstetric and physiological point of view, the myometrial tissues may undergo a physiologic aging process, or may become less effective to oxytocin and other uterotonics with age [16]. Similarly, aging is also associated with skeletal muscle strength deterioration which can be linked to inability of the uterus to contract steadily and strongly to women aged ≥35 years as pointed out by the current study.
Table 3. Relationship of sociodemographic characteristics with maternal birth outcomes (N=400).
|
Characteristics |
Duration of Labor |
c2 |
P<0.05 |
Mode of Delivery |
c2 |
P<0.05 |
||
|
≤12 h, n% |
>12 h, n% |
Cesarean |
SVD, n% |
|||||
|
Age (years) |
|
|
|
|
|
|
|
|
|
≤19 |
34 (34.6) |
44 (65.4) |
|
|
29 937.2) |
49 (62.8) |
|
|
|
20 to 34 |
51 (19.8) |
207 (80.2) |
|
|
70 (27.1) |
188 (72.9) |
|
|
|
≥35 |
17 (26.6) |
47 (73.4) |
17.937 |
<0.001 |
18 (28.1) |
46 (71.9) |
2.968 |
0.227 |
|
Marital status |
|
|
|
|
|
|
|
|
|
Not married |
9 (40.9) |
13 (59.1) |
|
|
8 (36.4) |
14 (63.6) |
|
|
|
Married |
93 (24.6) |
285 (75.4) |
2.910 |
0.088 |
109 (28.8) |
269 (71.2) |
0.569 |
0.451 |
|
Residence |
|
|
|
|
|
|
|
|
|
Rural |
63 (25.7) |
182 (74.3) |
|
|
83 (33.9) |
162 (66.1) |
|
|
|
Urban |
39 (25.2) |
116 (74.8) |
0.052 |
0.902 |
34 (21.9) |
121 (78.1) |
6.543 |
0.011 |
|
Admission type |
|
|
|
|
|
|
|
|
|
Medical |
21 (35.0) |
39 (65.0) |
|
|
48 (80.0) |
12 (20.0) |
|
|
|
Self |
81 (23.8) |
259 (76.2) |
3.353 |
0.067 |
69 (20.3) |
271 (79.7) |
87.85 |
0.001 |
|
Gravidity |
|
|
|
|
|
|
|
|
|
1 |
38 (48.5) |
45 (54.2) |
|
|
34 (41.0) |
49 (59.0) |
|
|
|
2 to 4 |
40 (20.3) |
159 (79.9) |
|
|
51 (25.6) |
148 (74.4) |
|
|
|
≥5 |
24 (20.3) |
94 (79.7) |
22.68 |
<0.001 |
32 (27.1) |
86 (72.9) |
7.024 |
0.034 |
|
Parity |
|
|
|
|
|
|
|
|
|
0 to 1 |
62 (34.6) |
117 (65.4) |
|
|
61 (34.1) |
118 (65.9) |
|
|
|
2 to 4 |
22 (16.8) |
109 (83.2) |
|
|
30 (22.9) |
101 (77.1) |
|
|
|
≥5 |
18 (20.0) |
72 (80.0) |
14.53 |
<0.001 |
26 (28.9) |
71.1) |
4.574 |
0.102 |
|
ANC visits |
|
|
|
|
|
|
|
|
|
≤3 |
50 (29.4) |
120 (70.6) |
|
|
47 (27.6) |
123 (72.4) |
|
|
|
≥4 |
52 (22.6) |
176 (77.4) |
2.381 |
0.123 |
70 (30.4) |
160 (69.6) |
0.367 |
0.545 |
|
IPTp-SP |
|
|
|
|
|
|
|
|
|
1 to 2 |
47 (29.6) |
112 (70.4) |
|
|
43 (27.0) |
116 (73.0) |
|
|
|
≥3 |
55 (22.8) |
186 (77.2) |
2.290 |
0.130 |
74 (30.4) |
167 (69.3) |
0.621 |
0.431 |
|
ANC HIV status |
|
|
|
|
|
|
|
|
|
PMTCT 2 |
101 (25.8) |
291 (74.2) |
|
|
116 (29.6) |
276 (70.4) |
|
|
|
PMTCT1 |
1 (12.5) |
7 (87.5) |
0.726 |
0.394 |
1 (12.5) |
7 (87.5) |
1.107 |
0.293 |
|
Hemoglobin |
|
|
|
|
|
|
|
|
|
Not checked |
71 (28.3 |
180 (71.7 |
|
|
71 (28.3 |
180 (71.7 |
|
|
|
Checked |
31 (20.8) |
118 (79.2) |
2.755 |
0.097 |
46 (30.9) |
103 (69.1) |
0.302 |
0.583 |
|
Systolic BP (mmHg) |
|
|
|
|
|
|
|
|
|
≤120 |
52 (23.6) |
168 (76.4) |
|
|
62 (28.2) |
156 (71.8) |
|
|
|
120 to 129 |
35 (25.0) |
105 (75.0) |
|
|
40 (28.6) |
100 (71.4) |
|
|
|
130 to 139 |
14 (36.8) |
24 (63.2) |
|
|
13 (34.2) |
25 (65.5) |
|
|
|
≥140 |
1 (50.0) |
1 (50.0) |
3.626 |
0.305 |
2 (100.0) |
0 (0.0) |
5.442 |
0.142 |
|
Diastolic BP (mmHg) |
|
|
|
|
|
|
|
|
|
≤80 |
69 (25.4) |
203 (74.6) |
|
|
82 (30.1) |
190 (69.9) |
|
|
|
80 to 84 |
29 (25.4) |
85 (74.6) |
|
|
28 (24.6) |
86 (75.4) |
|
|
|
85 to 89 |
1 (16.7) |
5 (83.3) |
|
|
2 (33.3) |
4 (66.7) |
|
|
|
≥90 |
3 (37.5) |
5 (62.5) |
0.856 |
0836 |
5 (62.5) |
3 (37.5) |
5.639 |
0.131 |
|
Membrane status on admission |
|
|
|
|
|
|
|
|
|
Intact |
60 (24.9) |
181 (75.1) |
|
|
65 (27.0) |
176(73.0) |
|
|
|
Ruptured |
42 (26.4) |
117 (73.6) |
0.116 |
0.733 |
52 (32.7) |
107(67.3) |
1.522 |
0.217 |
|
Nature of labor |
|
|
|
|
|
|
|
|
|
Normal |
48 (17.0) |
234 (83.0) |
|
|
6 (2.1) |
276 (97.9) |
|
|
|
Abnormal |
53 (44.9) |
65 (55.1) |
34.294 |
<0.001 |
106 (89.8) |
12 (10.2) |
317.401 |
<0.001 |
|
Fetal presentation |
|
|
|
|
|
|
|
|
|
None-cephalic |
10 (50.0) |
10 (50.0) |
|
|
8 (40.0) |
12 (60.0) |
|
|
|
Cephalic |
92 (24.2) |
288 (75.8) |
6.652 |
0.010 |
109 (28.7) |
271 (71.3) |
1.176 |
0.278 |
|
Fetal position |
|
|
|
|
|
|
|
|
|
Others |
10 (52.6) |
9 (47.4) |
|
|
7 (36.8) |
12 (63.2) |
|
|
|
LOA |
34 (20.9) |
129 (79.1) |
|
|
33 (20.2) |
130 (79.8) |
|
|
|
ROA |
58 (26.6) |
160 (73.4) |
9.351 |
0.009 |
77 (35.3) |
141 (64.7) |
9.767 |
0.008 |
|
FHR on admission (bpm) |
|
|
|
|
|
|
|
|
|
160 |
5 (35.7) |
9 (64.3) |
|
|
10 (71.4) |
4 (28.6) |
|
|
|
110 to 160 |
97 (25.1) |
289 (74.9) |
0.797 |
0.372 |
107 (27.7) |
279 (72.3) |
12.472 |
<0.001 |
|
Birth weight (kg) |
|
|
|
|
|
|
|
|
|
≤ 2.4 |
9 (30.0) |
21 (70.0) |
|
|
4 (13.3) |
26 (86.7) |
|
|
|
≥2.5 |
93 (25.1) |
277 (74.9) |
0.346 |
0.557 |
113 (30.5) |
257 (69.5) |
3.970 |
0.046 |
|
Sex of baby |
|
|
|
|
|
|
|
|
|
Female |
44 (24.0) |
139 (76.0) |
|
|
63 (34.4) |
120 (65.6) |
|
|
|
Male |
58 (26.7) |
159 (73.3) |
0.377 |
0.539 |
54 (24.9) |
163 (75.1) |
4.367 |
0.037 |
Table 4. Determinants of duration of labor and mode of delivery among women attended at SDH for labor and delivery (N=400).
|
|
Variables |
COR |
95% CI |
P≤0.05 |
AOR |
95% CI |
P≤0.05 |
||
|
Lower |
Upper |
Lower |
Upper |
||||||
|
Duration of Labor |
Age (years) |
|
|
|
|
|
|
|
|
|
≤19 |
Ref |
|
|
|
|
|
|
|
|
|
20 to 34 |
0.468 |
0.230 |
0.955 |
0.037 |
1.714 |
.549 |
5.350 |
0.354 |
|
|
≥35 |
1.505 |
0.798 |
2.839 |
0.207 |
2.558 |
1.018 |
6.426 |
0.046 |
|
|
Gravidity |
|
|
|
|
|
|
|
|
|
|
1 |
Ref |
|
|
|
|
|
|
|
|
|
2 to 4 |
0.302 |
0.162 |
0.563 |
0.001 |
0.614 |
0.169 |
2.231 |
0.459 |
|
|
≥5 |
1.047 |
0.593 |
1.850 |
0.873 |
1.316 |
.446 |
3.886 |
0.619 |
|
|
Parity |
|
|
|
|
|
|
|
|
|
|
0 to 1 |
Ref |
|
|
|
|
|
|
|
|
|
2 to 4 |
0.472 |
0.259 |
0.861 |
0.014 |
0.258 |
0.062 |
1.080 |
0.064 |
|
|
≥5 |
1.310 |
0.653 |
2.627 |
0.448 |
0.466 |
0.140 |
1.554 |
0.214 |
|
|
Nature of labor |
|
|
|
|
|
|
|
|
|
|
Normal |
Ref |
|
|
|
|
|
|
|
|
|
Abnormal |
3.975 |
2.466 |
6.408 |
<0.001 |
3.562 |
2.106 |
6.024 |
<0.001 |
|
|
Presentation |
|
|
|
|
|
|
|
|
|
|
Non-cephalic |
Ref |
|
|
|
|
|
|
|
|
|
Cephalic |
0.315 |
0.127 |
0.780 |
0.013 |
0.119 |
0.024 |
0.582 |
0.009 |
|
|
Fetal position |
|
|
|
|
|
|
|
|
|
|
Others |
|
|
|
|
|
|
|
|
|
|
LOA |
0.369 |
0.129 |
1.057 |
0.063 |
2.425 |
0.415 |
14.174 |
0.325 |
|
|
ROA |
0.810 |
0.504 |
1.302 |
0.384 |
0.742 |
0.448 |
1.229 |
0.246 |
|
|
Mode of Delivery |
Residence |
|
|
|
|
|
|
|
|
|
Rural |
Ref |
|
|
|
|
|
|
|
|
|
Urban |
0.537 |
0.335 |
0.860 |
<0.010 |
.596 |
.372 |
.954 |
0.031 |
|
|
Admission type |
|
|
|
|
|
|
|
|
|
|
Medical |
Ref |
|
|
|
|
|
|
|
|
|
Self |
0.065 |
0.033 |
0.128 |
<0.001 |
0.473 |
0.173 |
1.292 |
0.144 |
|
|
Gravidity |
|
|
|
|
|
|
|
|
|
|
1 |
Ref |
|
|
|
|
|
|
|
|
|
2 to 4 |
0.517 |
0.282 |
0.945 |
0.032 |
0.402 |
0.219 |
0.736 |
0.003 |
|
|
≥5 |
1.044 |
0.617 |
1.764 |
0.873 |
0.794 |
0.469 |
1.345 |
0.391 |
|
|
Nature of labor |
|
|
|
|
|
|
|
|
|
|
Normal |
Ref |
|
|
|
|
|
|
|
|
|
Abnormal |
64.158 |
33.347 |
123.437 |
<0.001 |
51.418 |
24.412 |
108.298 |
<0.001 |
|
|
Fetal position |
|
|
|
|
|
|
|
|
|
|
Others |
Ref |
|
|
|
|
|
|
|
|
|
LOA |
1.116 |
0.301 |
4.140 |
0.869 |
2.409 |
0.325 |
17.882 |
0.390 |
|
|
ROA |
0.491 |
0.307 |
0.785 |
0.003 |
0.952 |
0.473 |
1.916 |
0.890 |
|
|
FHR on admission (bpm) |
|
|
|
|
|
|
|
|
|
|
160 |
Ref |
|
|
|
|
|
|
|
|
|
110 to 160 |
0.170 |
0.052 |
0.552 |
0.003 |
0.713 |
0.124 |
4.103 |
0.705 |
|
|
Birth weight (kg) |
|
|
|
|
|
|
|
|
|
|
≤ 2.4 |
Ref |
|
|
|
|
|
|
|
|
|
≥2.5 |
2.679 |
0.913 |
7.861 |
0.073 |
2.713 |
.991 |
7.431 |
0.052 |
|
|
Sex of baby |
|
|
|
|
|
|
|
|
|
|
Female |
Ref |
|
|
|
|
|
|
|
|
|
Male |
0.646 |
0.417 |
1.002 |
0.050 |
0.618 |
0.313 |
1.218 |
0.164 |
|
COR: Crude Ration; AOR: Adjusted Odds Ratio; CI: Confidence Interval
Further, it was identified that abnormal labor, especially associated with obstructed labor, prolonged duration of labor by more than three-folds. A study that adopted case-control methodology supported the current study by purporting that obstructed labor can prolong labor to > 24 h by more than seven-folds [14]. The tendency of pregnant women in the study setting to try labor at home and come to health facility with already swollen perineum can be the reason for the observed results. On the other hand, these mothers may have increased obstructed labor risk in relation to nutritional habit and knowledge, demographic characteristics and other factors as cited in the literature [45].
Conversely, cephalic fetal presentation decreased the odds of having prolonged duration of labor (>12 h). There is scanty literature that define the association of cephalic presentation vs. duration of labor. However, cephalic presentation, especially where the fetus is in complete attitude, the baby tends to navigate best through the pelvis [46], and hence increasing the chance of reaching second stage within the recommended time [11]. An extensive study is needed to explore the cause-effect regarding the association of cephalic presentation with duration of labor in first stage of labor.
Regarding the mode of delivery, the study found that over one-quarter (29.2%) of the participants underwent CS delivery, mainly due to abnormal labor associated with obstructed labor and other causes (Figure 1). In African context, CS deliveries are conducted as emergency interventions [21]. According to a recent hospital-based retrospective study conducted at Kilimanjaro Christian Medical Centre (KCMC), the prevalence of CS was 26.75% which was almost within our results, and were undertaken due to almost similar indications [22]. The explanation for the observed similarity can be centered to sociodemographic and obstetric nature of our community, and has also been noticed by others [23,27]. Besides, one study in Uganda found a high rate of CS deliveries (38.3%) from rural hospitals [47], which had similar characteristics with Serengeti district hospital in terms of geographical location. However, the reported rate of CS in our study and others, are higher than the recommended threshold of between 10 to 15% by WHO (34). According to WHO statement of cesarean section rates, CS rates of 15% indicate inadequate utilization of CS services among women who need them, and injudicious use of without medically indicated reasons, respectively [34].
This study identified several predictors of mode of delivery. It was discovered that urban residents were less likely to undergo CS delivery compared to their counterparts. Contrary to the current results, a retrospective cohort study (2000-2015), identified that, the risk of CS delivery increased by 1.3-fold among urban residents [22]. Surprisingly, another study indicated the association of rural residency with CS deliveries [26]. The possible explanation for observed conflicting results might be linked to methodological differences. The current study adopted a cross-sectional approach against retrospective cohort methodology employed by the most of reviewed studies.
Another factor found to predict mode of delivery was multigravidity. It was noted that if the current pregnancy was between 2 to 4, reduced the odds of CS delivery. Although to the best knowledge of the researcher, there are limited literature ever investigated the association of multigravida and decision of mode of delivery, the reviewed study from Southern Ethiopia [24] supported the motion. A contradictory result was however, documented in a study conducted to assess socioeconomic and demographic factors associated with caesarean section delivery in Southern Ghana. In this study revealed that the reduced chance to choose CS as a mode of delivery was by 60, 37, and 35% for women with parities 2, 3 and 3+ respectively [27], and not with multigravidae as it was noted in the current study. The observed differences can be explained considering the dissimilarity in the factors assessed in the previous studies. Concerning reason why multigravida reduced CS delivery, this might be closely linked to anatomical and physiological nature of the cervical collagen fiber dissolution described among multiparous women [22].
With reference to nature of labor, the current study indicated that a woman with abnormal labor was fifty times likely to undergo CS delivery. Contrary to the current study which revealed that abnormal labor associated with such factors as obstructed labor, poor progress of labor, previous scar, placenta previa and APH or Pre/Eclampsia to a live baby as cited by other studies [21,23,48]; a study conducted elsewhere in Eastern and Central Africa, noted the odds of choosing CS delivery as a mode of delivery was increased with obstruction related to intrauterine fetal deaths (IUFD) [20]. The possible explanation for the observed differences can be centered to the fact that CS deliveries might be conducted for profit or as a medical decision without relative or absolute indication for it as it has been cited by other studies [23].
CONCLUSIONS
There are high CS deliveries at SDH, almost two times higher than the WHO recommended CS rates. ANC Hgb checkup is also inadequate by over two quarter. Admission with membranes already ruptured indicates that pregnant women come late, already in active or almost in second stage of labor. Abnormal labor found to be the significant factor for both durations of labor and mode of delivery. There is a need for additional studies exploring the reasons for the much higher than expected CS rates. CHMT also should conduct extensive supportive supervision to underscore ANC services especially Hgb checkups to pregnant women.
Acknowledgements: The Author would like to acknowledge the SDH management and in Charge for Maternity ward for granting permission to use clinical data on hospital deliveries to analyze the determinants of duration of labor and mode of delivery among women giving birth at SDH.
Conflict of Interest: Authors declare that there is no competing interest.
Author Contributions: MBT conceptualized and designed the study, obtained datasets, conducted analysis, interpreted the results, drafted and reviewed the manuscript.
Ethical Considerations: Permission to analyze clinical data on hospital deliveries, permission was sought in written from the nurse manager for maternity ward and medical superintendent for Serengeti district hospital. Since the study employed secondary data (partograph data), there was neither verbal nor written informed consent from participants whose data was used. Anonymous data entry was done to ensure confidentiality.
- Alkema L, Chou D, Hogan D, Zhang S, Moller A-B, et al. (2016) National, regional and global levels and trend in MMR between 1990 and 2015 with scenario-based projections to 2030; A systematic analysis by the United Nations Maternal Mortality. Lancet 387(10017): 462-474.
- World Health Organization (2019) Trends in maternal mortality 2000 to 2017: Estimates by WHO, UNICEF, UNFPA, World Bank Group and the United Nations Population Division. Geneva.
- United Nations Child’s Funds (2019) Trends in estimates of maternal mortality ratio (maternal deaths per 100,000 live births) 2000-2017.
- Ngonzi J, Tornes YF, Mukasa PK, Salongo W, Kabakyenga J, et al. (2016) Puerperal sepsis, the leading cause of maternal deaths at a Tertiary University Teaching Hospital in Uganda. BMC Pregnancy Childbirth 16: 207.
- National Bureau of Statistics (2016) Tanzania Demographic and Health Survey and Malaria Indicator Survey (TDHS-MIS) pp: 172-173.
- Bwana VM, Rumisha SF, Mremi IR, Lyimo EP, Mboera LEG (2019) Patterns and causes of hospital maternal mortality in Tanzania: A 10-year retrospective analysis. PLoS One. 14(4): e0214807.
- Elie N (2014) Maternal and neonatal complications of macrosomia. Trop Doct 44(4): 201-204.
- Anggondowati T, El-Mohandes AAE, Qomariyah SN, Kiely M, Ryon JJ, et al. (2017) Maternal characteristics and obstetrical complications impact neonatal outcomes in Indonesia: A prospective study. BMC Pregnancy Childbirth 17: 100.
- Najati N, Gojazadeh M (2010) Maternal and neonatal complications in mothers aged under 18 years. Patient Prefer Adherence 4: 219-222.
- American College of Obstetrics and Gynecology Committee on Practice Bulletins-Obstetrics (2003) ACOG Practice Bulletin Number 49, December 2003: Dystocia and augmentation of labor. Obstet Gynecol 102(1): 203-213.
- Dutta D (2013) DC Dutta’s Textbook of obstetrics, including perinatology and contraception. New Delhi: Jaypee Brothers Medical Publishers (P) pp: 401.
- Papadias K, Christopoulos P, Deligeoroglou E, Vitoratos N, Makrakis E, et al. (2006) Maternal age and the duration of the second stage of labor. Ann N Y Acad Sci 1092: 414-417.
- Gudayu TW, Araya BM (2019) Outcomes among mothers who gave birth in the health facility: Does birth preparedness and complication readiness have a role? Obstet Gynecol Int 2019: 20266.
- Desta M, Mekonen Z, Alemu AA, Demelash M, Getaneh T, et al. (2022) Determinants of obstructed labour and its adverse outcomes among women who gave birth in Hawassa University referral Hospital: A case-control study. PLoS One 17(6): e0268938.
- Harrison MS, Goldenberg RL, Ali S, Pasha O, Saleem S, et al. (2015) A prospective population-based study of maternal, fetal, and neonatal outcomes in the setting of prolonged labor, obstructed labor and failure to progress in low- and middle-income countries. Reprod Health 12(2): S9.
- Greenberg MB, Cheng YW, Sullivan M, Norton ME, Hopkins LM, et al. (2007) Does length of labor vary by maternal age? Am J Obstet Gynecol 197(428): e1-428.e7.
- Chen H, Cao L, Cao W, Wang H, Zhu C, et al. (2018) Factors affecting labor duration in Chinese pregnant women. Medicine (Baltimore) 97: 52.
- Abebe FE, Gebeyehu AW, Kidane AN, Eyassu GA (2016) Factors leading to cesarean section delivery at Felegehiwot referral hospital, Northwest Ethiopia: A retrospective record review. Reprod Health 13: 16.
- Govender I, Steyn C, Maphasha O, Abdulrazak AT (2019) A profile of caesarean sections performed at a district hospital in Tshwane, South Africa. South African Fam Pract 61(6): 246-251.
- Ngongo CJ, Raassen T, Lombard L, van Roosmalen J, Weyers S, et al. (2020) Delivery mode for prolonged, obstructed labor resulting in obstetric fistula: A retrospective review of 4396 women in East and Central Africa. BJOG An Int J Obstet Gynaecol 127(6): 702-707.
- Shah A, Fawole B, M’Imunya JM, Amokrane F, Nafiou I, et al. (2009) Cesarean delivery outcomes from the WHO global survey on maternal and perinatal health in Africa. Int J Gynecol Obstet 107(3): 191-197.
- Tarimo CS, Mahande MJ, Obure J (2020) Prevalence and risk factors for caesarean delivery following labor induction at a tertiary hospital in North Tanzania: A retrospective cohort study (2000-2015). BMC Pregnancy Childbirth 20: 173.
- Begum T, Rahman A, Nababan H, Emdadul Hoque DM, Khan AF, et al. (2017) Indications and determinants of caesarean section delivery: Evidence from a population-based study in Matlab, Bangladesh. PLoS One 12(11): e0188074.
- Zewude B, Siraw G, Adem Y (2022) The Preferences of Modes of Child Delivery and Associated Factors Among Pregnant Women in Southern Ethiopia. Pragmatic Obs Res 13: 59-73.
- United Nations. (2016) Transforming our world: the 2030 agenda for sustainable development.
- Nilsen C, Østbye T, Daltveit AK, Mmbaga BT, Sandøy IF (2014) Trends in and socio-demographic factors associated with caesarean section at a Tanzanian referral hospital, 2000 to 2013. Int J Equity Health 13: 87.
- Manyeh AK, Amu A, Akpakli DE, Williams J, Gyapong M (2018) Socioeconomic and demographic factors associated with caesarean section delivery in Southern Ghana: Evidence from INDEPTH Network member site. BMC Pregnancy Childbirth 18: 405.
- Afaya A, Afaya RA, Azongo TB, Yakong VN, Konlan KD, et al. (2021) Maternal risk factors and neonatal outcomes associated with low birth weight in a secondary referral hospital in Ghana. Heliyon 7(5): e06962.
- Gwelo AS, Mbishi JV (2019) Determinants of adverse neonatal outcomes among postnatal women in Dar es Salaam-Tanzania. Afr Health Sci 19(2): 1924-1929.
- Tiruneh D, Assefa N, Mengiste B (2021) Perinatal mortality and its determinants in Sub Saharan African countries: Systematic review and meta-analysis. Matern Heal Neonatol Perinatol 7: 1.
- Betran AP, Ye J, Moller AB, Souza JP, Zhang J (2021) Trends and projections of caesarean section rates: Global and regional estimates. BMJ Glob Health 6: e005671.
- Dikete M, Coppieters Y, Trigaux P, Fils J, Englert Y (2019) Variation of caesarean section rates in Sub-Saharan Africa: A literature review. J Gynecol Res Obstet 5(2): 042-427.
- Arunda OM, Agardh A, Asamoah BO (2020) Cesarean delivery and associated socioeconomic factors and neonatal survival outcome in Kenya and Tanzania: Analysis of national survey data. Glob Health Action 13: 1748403.
- World Health Organization (2015) WHO statement on cesarean section rates.
- Molina G, Weiser TG, Lipsitz SR, Esquivel MM, Uribe-Leitz T, et al. (2015) Relationship between cesarean delivery rate and maternal and neonatal mortality. J Am Med Assoc 314(21): 2263-2270.
- UNFPA (2014) Child marriage fact sheet [Internet]. Dar Es Salaam: UNFPA Vol: 14; pp: 1-4.
- Sumankuuro J, Mahama MY, Crockett J, Wang S, Young J (2019) Narratives on why pregnant women delay seeking maternal health care during delivery and obstetric complications in rural Ghana. BMC Pregnancy Childbirth 19: 260.
- Charan J, Biswas T (2013) How to calculate sample size for different study designs in medical research? Indian J Psychol Med 35(2): 121-126.
- Moshi F V, Tungaraza M (2021) Factors associated with blood pressure check-up during pregnancy among women of reproductive age in Tanzania: An analysis of data from 2015-16 Tanzania Demographic and Health Survey and Malaria Indicators Survey. BMC Pregnancy Childbirth 21: 465.
- Annie K, Taylor H, Jacquelyn CLA (2014) Focused antenatal care in Tanzania [Internet]. Women and Health Initiatives pp: 1-13.
- United Republic of Tanzania (2013) National guidelines for comprehensive care services for prevention of mother-to-child transmission of HIV and keeping mothers alive. Dar Es Salaam: Ministry of Health and Social Welfare, Tanzania.
- United Republic of Tanzania (2018) Antenatal care guidelines. Dodoma-Tanzania: MoHCDGEC.
- World Health Organization (2014) Global nutrition targets 2025: Low birth weight policy brief. Geneva, Switzerland: WHO.
- Williams B, Mancia G, Spiering W, Rosei EA, Azizi M, et al. (2023) 2018 ESC/ESH Guidelines for the management of arterial hypertension. Eur Heart J 39(33): 3021-3104.
- Gudina AT, Abebe TW, Gebremariam FA, Guto GJ (2016) Magnitude of obstructed labor and associated risk factors among mothers come for delivery service in Adama hospital medical college, Oromia regional state, central Ethiopia. J Gynecol Obstet 4(3): 12-16.
- Kilpatrick S, Garrison E (2017) Normal labor and delivery. Available online at: http://obgyn.azurewebsites.net/wp-content/uploads/2014/02/gabbe-normal-labor.pdf
- Nuwabaine L, Amperiize M, Nakalega PA (2020) High proportion of caesarean section at a rural hospital in south western Uganda: A cross sectional study. Pp: 1-22.
- Sørbye IK, Vangen S, Oneko O, Sundby J, Bergsjø P (2011) Caesarean section among referred and self-referred birthing women: A cohort study from a tertiary hospital, northeastern Tanzania. BMC Pregnancy Childbirth 11: 55.
QUICK LINKS
- SUBMIT MANUSCRIPT
- RECOMMEND THE JOURNAL
-
SUBSCRIBE FOR ALERTS
RELATED JOURNALS
- Archive of Obstetrics Gynecology and Reproductive Medicine (ISSN:2640-2297)
- International Journal of Medical and Clinical Imaging (ISSN:2573-1084)
- Journal of Nursing and Occupational Health (ISSN: 2640-0845)
- Journal of Psychiatry and Psychology Research (ISSN:2640-6136)
- Advance Research on Alzheimers and Parkinsons Disease
- Journal of Oral Health and Dentistry (ISSN: 2638-499X)
- Journal of Pathology and Toxicology Research